How MTS Works
How MTS Works
MTS (Market Trend System) is a market-structure and risk-evaluation framework. It helps users understand what the market is doing before taking decisions.
MTS Market Structure
The MTS (Market Trend Structure) Suite is a high-performance technical analysis software designed for the TradingView platform. It is built to assist traders in identifying market structure, trend velocity, and institutional supply/demand zones through objective mathematical algorithms.
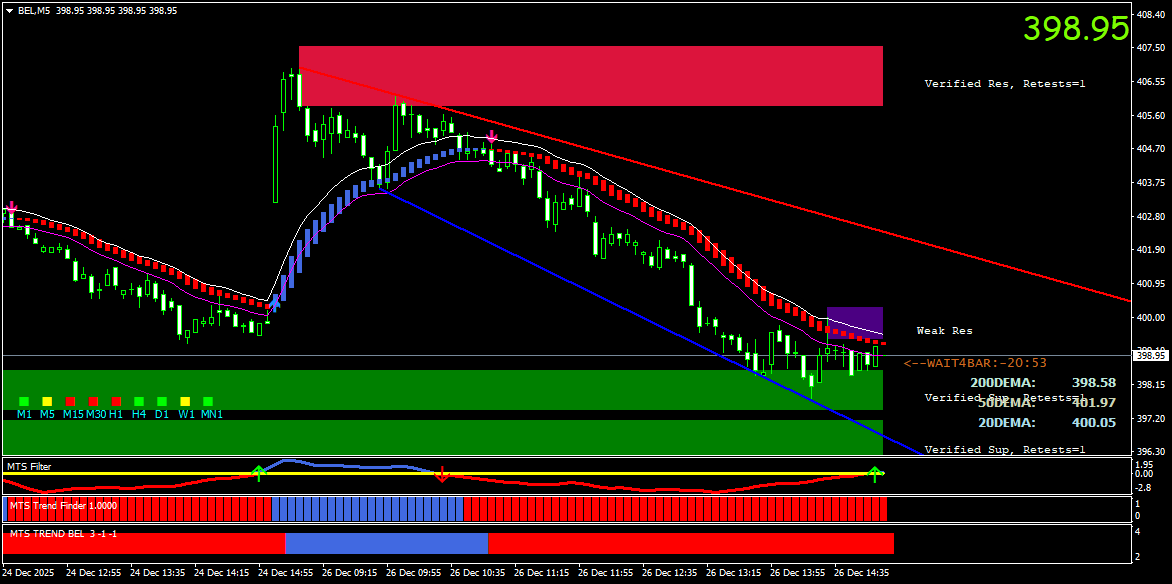
The chart illustrates how MTS interprets price behaviour using automatically generated trendlines, structural zones, and trend-momentum filters.
- Red trendline: Automatically projected resistance
- Blue trendline: Dynamically identified support
- Green zone: Structural demand area
- Trend & momentum filters: Validate participation strength
- No manual plotting: Entire structure adapts automatically
This illustration is for explanation only. It is not a trade signal or recommendation.
Full Explanation Sheet – How to Use MTS
1. Market Environment Identification
Markets move through different phases. MTS classifies trending, momentum-driven, or sideways environments.
- Trending environments support continuation logic
- Sideways environments require restraint
- Same approach is not applied everywhere
2. Multi-Timeframe Alignment
MTS evaluates structure across higher, intermediate, and lower timeframes.
- Alignment improves clarity
- Conflict increases noise
- Alignment prioritised over frequency
3. Momentum Strength Evaluation
MTS evaluates whether momentum supports continuation or is weakening.
- Strong momentum confirms participation
- Weak momentum signals caution
- Avoid low-quality conditions
4. Structural Zones & Trendlines
Support-resistance zones and trendlines are identified automatically.
- Zones define risk invalidation areas
- Trendlines adapt dynamically
- No manual plotting required
5. Risk-First Framework
Risk assessment is central to MTS participation logic.
- Risk defined before opportunity
- Capital protection prioritised
- Standing aside is valid
6. Sectoral & Multi-Asset Scanning
MTS scans across sectors and instruments displaying structure.
- Scanning reduces noise
- Helps prioritise attention
- Does not encourage over-activity